FLOOD & MULTI-HAZARD EARLY WARNING

Home » Flood Control Solutions » Early Warning Systems

Flood Early Warning and Monitoring Systems

Early warning you can see.

WaveSave combines sensor data, automated visual monitoring and decision support to help authorities understand not only that conditions are changing, but what is changing, where it is happening and why it matters.

Book a demo

  Visual monitoring in action

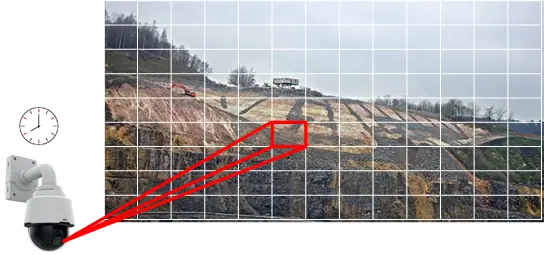
Camera monitoring a hillside, with the view divided into a grid and one zone highlighted

How does a flood early warning system work?

A flood early warning system, also called a flood monitoring and warning system, gives people time to act before the water arrives. The UN initiative Early Warnings for All describes four parts that have to work together: knowledge of the flood risk; detection, monitoring and forecasting of rainfall and water levels; warnings that reach the right people in time; and the preparedness to respond. WaveSave focuses on monitoring and warning: sensors measure water levels and rainfall, cameras show what is changing on site, and operators get the information they need to decide sooner.

WHY VISUAL INTELLIGENCE MATTERS

A sensor tells you a value changed. Visual intelligence adds context.

A water-level or rainfall sensor provides a precise measurement at a specific location. Visual monitoring adds context across the surrounding area, helping show what may be changing between or around sensor locations.

Point sensors

Excellent for precise measurements at known locations.

  • Water level
  • Rainfall
  • Flow or pressure
  • Weather conditions
  • Soil or ground movement
  • Other site-specific measurements


Precise data — from the point being measured.

Visual intelligence

Adds context across the visible monitored area.

  • Changing water extent
  • Erosion or surface change
  • Embankment condition
  • Slope movement
  • Cracks or visible ground change
  • Changes around critical infrastructure


Context that helps explain what the measurements may mean.

The goal is not to replace sensors. It is to combine precise measurements with visual information so decision-makers have a clearer picture of what is happening.

HOW THE SYSTEM WORKS

From monitoring to action

An effective early warning system must do more than collect data. It must turn changing conditions into information people can understand and act on.

01

Monitor

Collect the right information

Combine imagery, rainfall, water levels, weather and other relevant sensors.

02

Understand

Interpret what is changing

Use visual analysis, measurements, history and thresholds to identify meaningful change.

03

Warn

Put the event in context

Connect events to location, imagery, measurements and supporting information.

04

Act

Trigger the appropriate response

Trigger inspection, escalation or operational response based on the risk.

The objective is not to generate more alerts. It is to give the right people enough information to make a better decision sooner.

FROM ALERT TO EVIDENCE

A warning should be more than a notification

When monitored conditions trigger an event, operators should be able to understand what happened and investigate the evidence behind it. The iMaster/DocuCam platform is designed to connect warnings with the information needed to assess the situation quickly.

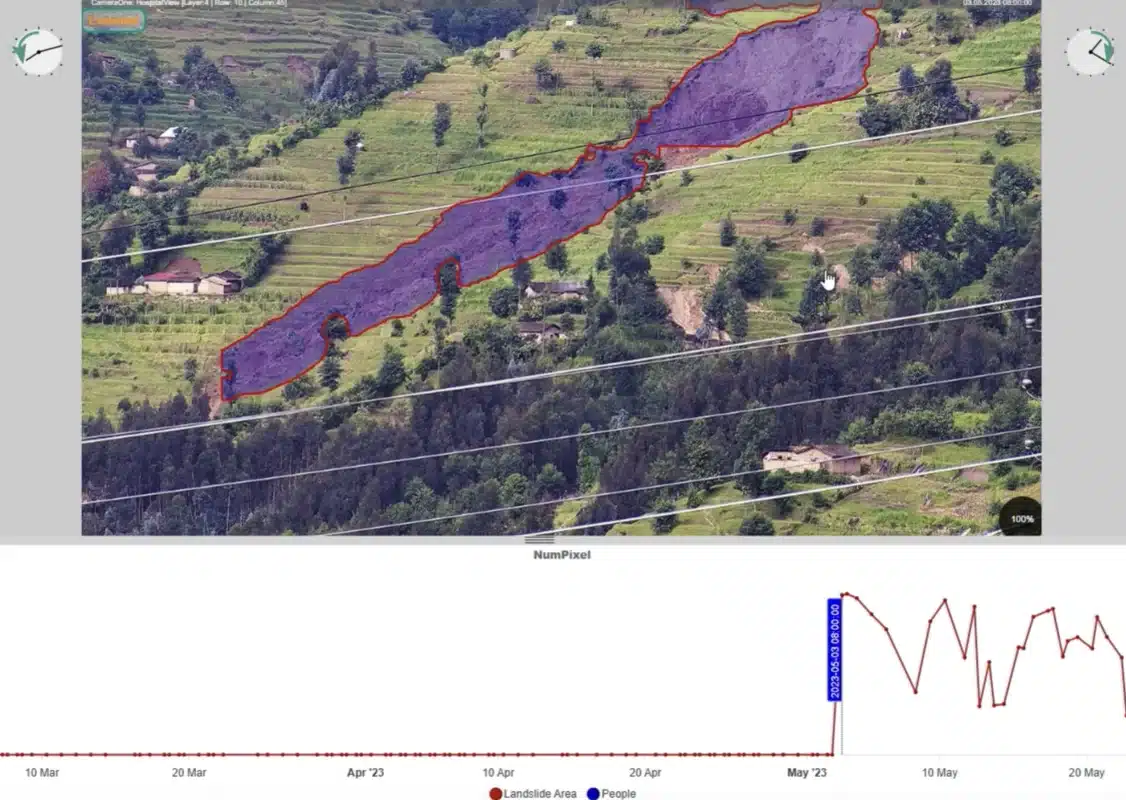
DocuCam analysis of a landslide on a terraced hillside in Rwanda, with the affected area marked and a time series below

Example iMaster/DocuCam monitoring interface from the Rwanda deployment.

What can an operator inspect?

Depending on the monitoring configuration, an event can connect the warning to supporting information such as:

  • The image associated with the event
  • Earlier images from the same monitored location
  • The exact location on a map
  • Measurement and time-series charts
  • Event start and end times
  • A generated report
  • Live or historical monitoring information

The result is a traceable record of what happened, where it happened and when.

Why this matters

A threshold tells you that something changed. Context helps your team decide whether that change needs inspection, escalation or immediate action.

FIELD EVIDENCE

What the Rwanda deployment demonstrated

The iMaster/DocuCam platform was installed in Rambura, Rwanda, as part of a government-supported pilot led by Rwanda’s Ministry in Charge of Emergency Management and Rwanda Space Agency, with GIZ funding and implementation by Hesotech. The results were later published in the peer-reviewed journal Progress in Disaster Science.

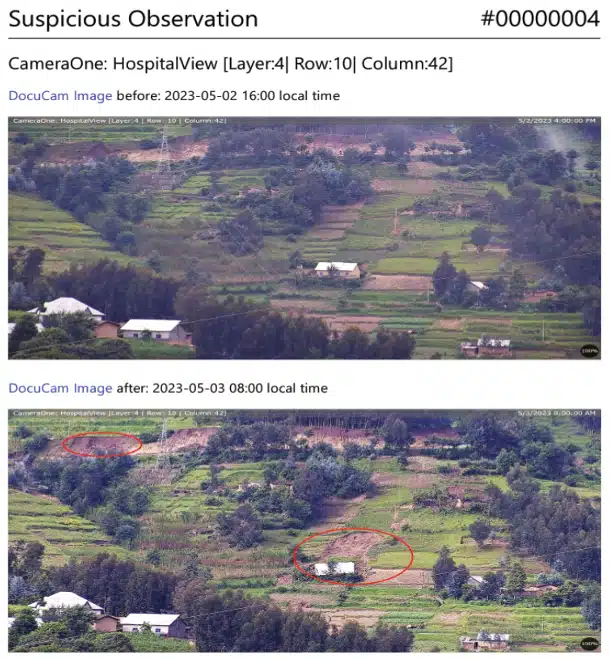
DocuCam observation report from Rwanda with before and after images of a hillside with houses

Example suspicious observation report from the Rambura, Rwanda deployment, showing before-and-after imagery linked to a detected event.

Real-world monitoring over time

The Rwanda study reports continuous collection of high-resolution imagery and weather data across the monitoring period. The system remained operational during severe weather associated with the May 2023 disaster.

  • Millions of images and weather records were collected during the study period.
  • More than 20 landslides were identified around the monitored area.
  • Computer-vision analysis was used to quantify visible change in monitored images.
  • An automated event could be generated when measured change exceeded a defined threshold.
  • All results could be stored and reviewed alongside the underlying imagery and environmental data.

The significance is not simply that the system captured photographs. It turned visual change into measurable, traceable information.

Visible changes can sometimes provide earlier warning

The study documented visible changes that appeared before subsequent slope failure. In one case, a growing erosion feature at a road boundary developed over several days before a landslide. In another, cracks along terraces indicated approximately one day of potential pre-warning.

These examples do not mean that every landslide — or every flood — can be predicted days in advance. They show why systematically recording and comparing visual change can add valuable information to conventional monitoring.

Peer-reviewed field evidence is not a universal prediction guarantee

Warning time and detectability depend on the hazard, site conditions, monitoring frequency, visibility and the indicators being monitored.

Read the peer-reviewed study →

Peer-reviewed research
Progress in Disaster Science, 2025
Patented technology
European patent EP3236440B1
Technology partner
Hesotech GmbH, Germany

In practice: flood early warning in Ba Town, Fiji

Ba Town is a commercial hub in Fiji. Frequent flooding in the Ba River basin threatens critical infrastructure, disrupts market operations and endangers local communities. In 2023–2024, for Fiji’s Ministry of Waterways and with financial support from the Government of the Netherlands, WaveSave delivered an integrated flood management system in three parts:

  • hydrodynamic modelling;
  • an IoT-enabled early warning system;
  • a training programme for the early warning system.

Read the full case: Early warning system in Ba Town, Fiji

FloodSmart early warning dashboard for Fiji with rainfall graphs for three measuring stations

How visual monitoring works

Images become measurements

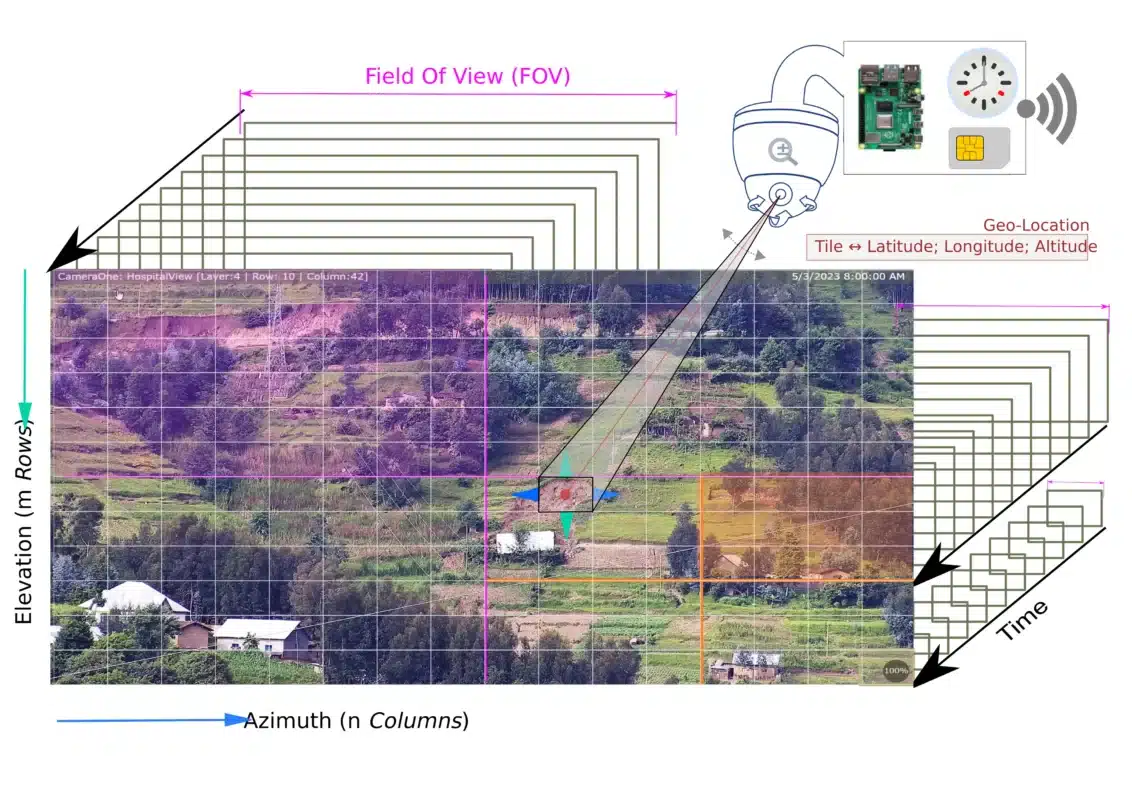
DocuCam does not simply record continuous video. A pan-tilt-zoom camera systematically captures a defined area as a structured series of geo-referenced images, allowing the same location to be compared repeatedly over time.

Diagram of visual monitoring: a camera views a landscape divided into a grid by azimuth and elevation

The same place, observed repeatedly

The camera begins with an overview of the monitored area and progressively captures defined image tiles at the required zoom level. Each tile can be linked to a specific viewing position and geographic location.

Because the same part of the landscape is recorded repeatedly, images from different moments can be compared automatically. Visible changes can then be quantified rather than relying on someone manually watching a camera feed.

From image to information

Computer-vision or other evaluation algorithms can analyse incoming imagery for relevant changes. The underlying image remains available, so operators can inspect the evidence behind a detected event and compare it with historical observations.

01

Capture

Record the same monitored locations systematically.

02

Compare

Measure how those locations change over time.

03

Interpret

Use defined algorithms and thresholds to identify relevant change.


This is what makes visual monitoring fundamentally different from ordinary CCTV: the imagery becomes structured data that can be searched, compared and analysed.


Works with more than imagery


Visual monitoring can be combined with other relevant measurements and spatial information where the monitoring objective requires it.


Weather


Water levels


Ground movement


GIS & remote sensing


Existing systems & APIs

Designing a reliable monitoring system

 Designed for field deployment — with clear limits

The documented configuration supports low-power, solar-capable operation, mobile connectivity and local data buffering. Optical monitoring still depends on visibility, line of sight and a site-specific monitoring design.

Designed for field operation

Practical deployment beyond the control room

  • Less than 16 W power in the documented DocuCam configuration
  • Mains or solar power
  • 4G mobile-data connectivity
  • Local buffering during temporary connection loss
  • Remote configuration and system management

Design limitations

Cameras cannot observe everything

  • Heavy rain and fog can reduce visibility
  • The documented configuration does not provide night-time imagery
  • Coverage depends on terrain, line of sight and camera position
  • Subsurface processes may require dedicated ground sensors
  • Monitoring frequency must match the speed of the hazard

Use visual monitoring where context matters. Use dedicated sensors where precise point, subsurface or continuous measurements are essential. Combine them when both are needed.

Applications

Where early warning can add value

Different organisations need different information from an early warning system. The monitoring design should therefore start with the decision that needs to be made — which locations matter, which changes need to be detected and what action should follow.

For an example in an urban setting, see how WaveSave supports an early warning system in Ba Town, Fiji.

Municipalities & drainage authorities

What is happening at the locations most likely to affect people and services?

Monitor flood-prone roads, urban waterways, culverts, drainage infrastructure, retention areas and other vulnerable locations where changing conditions may require early intervention.

Water authorities & river managers

What is happening around the measurements we already receive?

Combine water-level, rainfall and other sensor data with visual information around rivers, embankments, hydraulic structures and monitored catchment locations.

Infrastructure operators

Is the asset itself — or the terrain around it — beginning to change?

Add monitoring around roads, railways, dams, reservoirs, power infrastructure, embankments, slopes and other critical assets where visible change can affect safety or continuity.

Disaster-management organisations

What happened, where did it happen and who needs to respond?

Bring event location, monitoring data, imagery and warning information into operational procedures so responsible teams can assess, escalate and respond more quickly.

Development organisations & NGOs

What monitoring approach is practical, maintainable and useful locally?

Develop monitoring systems around local risks, infrastructure and response capacity, including locations where power, communications or technical resources may be constrained.

From warning to response

Early warning only matters if it leads to action

Detecting a potentially dangerous change is only the beginning. The real value of an early warning system is the time it creates to assess the situation, decide what matters and activate the appropriate response before impacts escalate.

Build the response before the warning arrives

A useful warning needs a predefined path from information to decision. That means agreeing in advance who receives the warning, how it is verified, when it is escalated and which operational response follows.

1. Assess
Review the event, location, measurements and available visual evidence.

2. Decide
Determine whether the situation requires observation, escalation or immediate intervention.

3. Mobilise
Notify the responsible teams and activate the relevant operational procedure.

4. Act
Implement the measure needed to reduce risk to people, infrastructure or services.

Depending on the risk

Early action could include

  • Dispatching an inspection team
  • Closing a vulnerable road or access route
  • Activating pumps or other water-management measures
  • Protecting critical infrastructure
  • Warning affected communities
  • Activating evacuation or emergency procedures
  • Deploying temporary flood protection where appropriate

The response depends on the hazard. The important part is that the warning is linked to a decision that has already been thought through.

The WaveSave difference

Connect warning with practical resilience measures

WaveSave approaches early warning as part of a wider water and climate resilience strategy. Monitoring can be connected with flood modelling, operational procedures, infrastructure protection, training and — where appropriate — temporary flood-protection measures.

Explore WaveSave flood protection solutions →

Frequently asked questions

Questions about flood early warning systems

The right early warning system depends on the hazard, site and decisions that need to follow. These are some of the questions we are most often asked about visual monitoring and sensor integration.

A flood early warning system monitors conditions that may indicate increasing flood risk and communicates relevant warnings so authorities, operators or communities have time to act. Depending on the location, it may combine rainfall, water levels, weather information, forecasting models, imagery and other monitoring technologies.

A water-level sensor provides a precise measurement at a specific location. Visual monitoring can add information about the surrounding area, such as changing water extent, erosion, slope movement or changes around infrastructure. The two approaches can complement each other rather than compete.

Yes, where the existing equipment provides a suitable electronic interface. The underlying platform is designed to receive information from different data sources through configurable drivers and APIs. The appropriate integration depends on the existing equipment, communications infrastructure and project requirements.

WaveSave delivers the system together with specialised partners: Hesotech for monitoring and, where needed, AeroSense for drone data and TAHMO for weather stations. Our hydrologists carry out the analyses and modelling, and we provide training together with our partners.

Yes. The supplied technology documentation demonstrates optical water-level measurement by measuring the visible water surface against a fixed reference point. Whether optical measurement or a conventional water-level sensor is preferable depends on the site, visibility and required monitoring frequency.

Image evaluation can use computer vision and AI-based methods to identify and quantify relevant changes. In the Rwanda study, a computer-vision algorithm was used to measure changes in imagery and support automated event generation. The platform is modular, so different evaluation methods can be applied according to the monitoring objective.

WaveSave therefore does not describe the system simply as “AI flood prediction”. The important question is what data is being evaluated, how the change is detected and what evidence supports the resulting warning.

There is no universal warning time. It depends on the hazard, site conditions, monitoring frequency, available data and how quickly the event develops. Some gradual changes may provide useful precursor information, while rapidly developing floods can allow much less time.

This is why WaveSave avoids promising a fixed number of warning hours or days without first understanding the location and the hazard being monitored.

Plan the right monitoring approach

What does your site need to detect — and what should happen next?

Tell us about the hazard, location, existing monitoring infrastructure and the decisions your team needs to make. WaveSave can help assess which combination of visual monitoring, sensors, modelling and operational response measures makes sense for your situation.

Book a demo

No one-size-fits-all package. We start with the site, the risk and the decision the warning needs to support.